
Decoding Product Carbon Footprints
Understand Product Carbon Footprints, from calculation methods to system boundaries.

Published:
What is a Product Carbon Footprint (PCF)?
A Product Carbon Footprint (PCF) is a technique for quantifying the greenhouse gas (GHG) emissions generated over the lifecycle of a specific commercial or industrial product. PCFs focus on the single impact category of climate change. They are one segment of Life Cycle Assessments (LCAs), which take a more comprehensive view, measuring additional environmental impact categories from ozone depletion to acidification of soils and water.
You can think of a PCF as a nutrition label for a product with only one nutrient: GHG emissions. In PCF terminology, the “serving size” is called a functional unit or declared unit (we dig into this more in the next section!).
Just as a nutrition label shows calories per serving size, a PCF aims to measure GHG emissions per functional (or declared) unit as an emissions intensity. How much CO2-equivalent (CO2eq) emissions were released per unit of product?
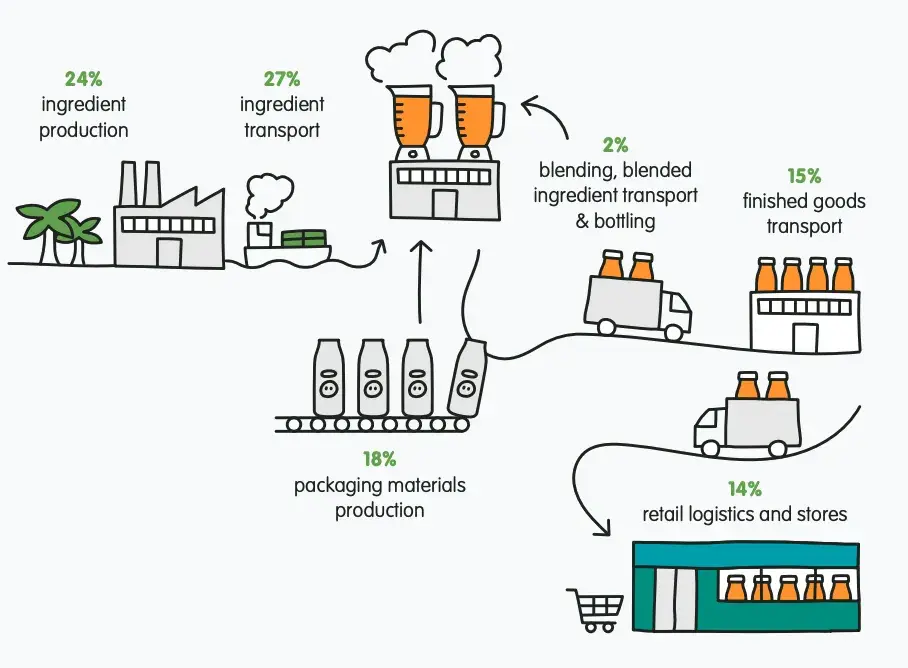
Below is an example of a PCF done for Innocent's orange juice, which has 900g of CO2eq per 900 mL bottle (functional unit).
PCFs can be leveraged to achieve many goals, including:
Goal | Benefits realized |
|---|---|
Identify GHG emissions hotspots across a product's lifecycle to prioritize mitigation efforts |
|
Enhance supply chain management processes |
|
Evaluate trade-offs of design changes, and avoid burden-shifting (i.e., one change increasing GHG emissions elsewhere) |
|
Gain a competitive advantage in B2B or B2C sales by offering a comparably lower-carbon product |
|
Satisfy data requests of diverse stakeholders (e.g., trade partners obligated under EU CBAM) or regulators (e.g., US Federal Buy Clean Initiative) |
|
In fact, robustly defining the goal of your PCF is the very first phase of conducting one.
There are multiple methodologies for performing PCFs as well as communicating them, but they all start with defining the goal and scope of your analysis: what you’ll study and how.
PCFs and LCAs serve as powerful means for organizations to simultaneously advance many corporate goals across sustainability, risk management, market competitiveness, stewardship, and industry reputation.
So, how do you leverage them?
How to Calculate PCFs: The Basics
Let’s walk through how a PCF is calculated.
Remember: when doing a PCF, we’re calculating the climate change impact (GHG emissions expressed in CO2eq) of all the processes that touch our product. This calculation follows the same basic formula as when calculating other company-related emissions:
𝑔ℎ𝑔𝐸𝑚𝑖𝑠𝑠𝑖𝑜𝑛𝑠=𝑎𝑐𝑡𝑖𝑣𝑖𝑡𝑦𝐷𝑎𝑡𝑎 𝑋 𝑒𝑚𝑖𝑠𝑠𝑖𝑜𝑛𝐹𝑎𝑐𝑡𝑜𝑟 𝑋 𝐺𝑊𝑃
Where:
ghgEmissions is the mass of GHGs released, expressed in CO2eq.
activityData is a physical or economic measure of activity levels. Examples include kWh of electricity used in a piece of factory equipment, km traveled along a shipping route, or dollars spent.
emissionFactor is a factor for converting activity data into GHG emissions data. Examples include kg CO2, kg CH4, and kg N2O (equation above is used 3 times, once for each GHG) released per kWh of grid electricity used, or kgCO2e (combines all GHGs) per cubic meter of cement purchased – a factor you might source from a PCF or LCA done by your cement supplier!
GWP is Global Warming Potential, a measure of the degree of atmospheric harm done by 1 unit of a given GHG relative to 1 unit of CO2. Multiplying the quantity of a GHG by its GWP converts that quantity into standard units of CO2-equivalents (CO2eq) and allows for summation of all GHG quantities into a single CO2eq quantity. CO2 has a GWP of 1. Be mindful that some emission factors are already expressed on a CO2eq basis, so the GWP conversion isn’t needed.
When calculating a PCF, a functional unit must be defined. A functional unit is a quantity of a product, e.g., 1 carton of pulp-free orange juice, that acts as a reference against which emissions from each process are measured. This allows for comparison and aggregation of impacts across all stages in the lifecycle of your product. If you’re doing a partial PCF, this unit is called a declared unit – same gist, but the reference unit is usually a specific mass or volume of a product rather than 1 unit, e.g., 1 cubic meter (m3) of cement.
Which Methodologies are Used to Calculate PCFs?
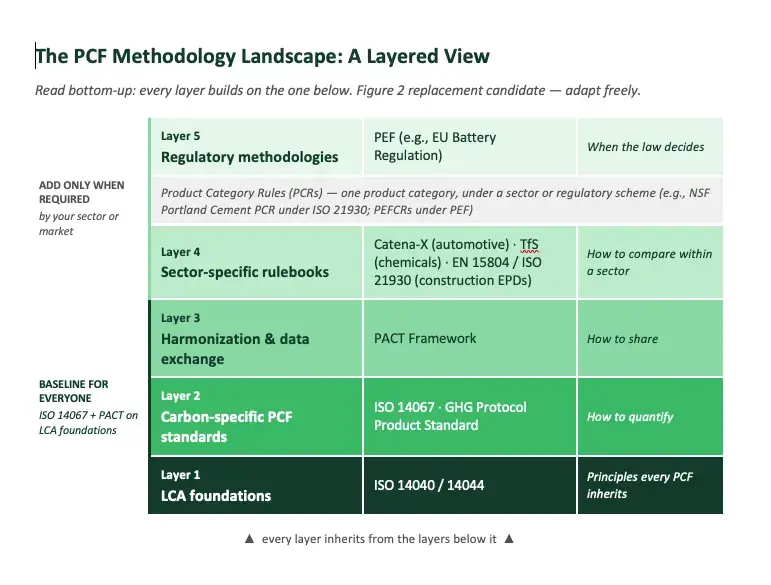
A PCF methodology is the set of rules that determines exactly how a product’s carbon footprint is calculated: what to include, how to allocate emissions, and what data counts as valid. Without a shared methodology, two companies calculating the “same” footprint can land on very different numbers, which is why choosing the right one matters for credibility and comparability in the market. The good news: you don’t have to evaluate every standard from scratch. PCF methodologies are layered, and understanding those layers makes the landscape far less intimidating.
The figure below outlines six different methodology standards that could be used for a PCF as well as the interrelationships between them and related standards.
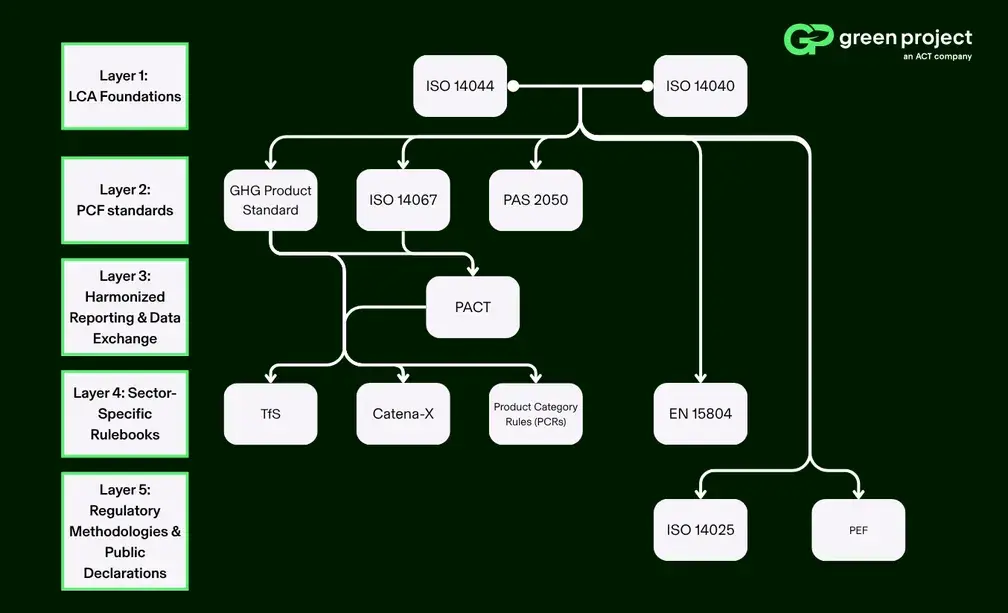
Layer 2 — Carbon-specific PCF standards. ISO 14067 and the GHG Protocol Product Standard are the two foundational PCF methodologies, each translating ISO 14040/14044’s LCA principles into carbon-specific guidance. They are broadly compatible (a PCF conforming to one can generally be made to conform to the other with modest additional documentation), and one of the two anchors nearly every credible PCF program.
Layer 3 — Harmonization and data exchange. The PACT Framework (published by WBCSD, formerly the Pathfinder Framework) builds on both foundational standards. It has been widely adopted across industries for its more prescriptive methodology, its work harmonizing PCF data models, and its data-sharing protocols. PACT’s core contribution is making PCFs exchangeable: a PACT-conformant footprint can travel from supplier to customer with its methodology, boundary, and data-quality metadata intact.
Layer 4 — Sector-specific standards. Cross-sectoral standards deliberately leave methodological choices open (allocation rules, cut-off criteria, secondary data sources), which limits comparability within an industry. That gap has driven the rise of sector-specific PCF standards, like Catena-X for automotive and Together for Sustainability (TfS) for chemicals, which lock down those choices so that two suppliers in the same sector produce genuinely comparable numbers.
Layer 5 — Regulatory methodologies. Some jurisdictions mandate a specific methodology. The EU’s Product Environmental Footprint (PEF) and its category rules (PEFCRs) are the most prominent example, required under regulations such as the EU Battery Regulation.
At a glance:
Standard | Publisher | Layer | Best suited for |
|---|---|---|---|
ISO 14040/14044 | ISO | LCA foundation | Underpins all PCFs; rarely used alone for carbon. |
ISO 14067 | ISO | Carbon-specific | The internationally recognized PCF quantification standard; the strongest anchor for third-party verification. |
GHG Protocol Product Standard | WRI/WBCSD | Carbon-specific | Organizations already reporting with GHG Protocol corporate standards. |
PACT Framework | WBCSD | Harmonization & exchange | Sharing PCFs with customers; responding to B2B data requests across industries. |
Catena-X PCF Ruleboook | Catena-X | Sector-Specific | Automotive value chains. |
TfS PCFs Guideline | Together for Sustainability | Sector-Specific | Chemical industry value chains. |
PEF / PEFCR | European Union | Regulatory | Products regulated in the EU. |
We recommend choosing a methodology standard based on four factors:
1. The type of product(s) in question. If a sector-specific standard exists for your industry, your customers will increasingly expect it.
2. Who is asking for the data. A customer’s Scope 3 program, a government buyer, and a regulator each accept different methodologies; start from the request, not the standard.
3. The geographic markets you serve. Selling into the EU can trigger PEF-based requirements; selling to US government projects points toward EPD-oriented standards.
4. The needs and ambitions of your company. A first PCF for internal hotspot analysis has different documentation demands than a footprint destined for third-party verification or on-product claims.
See the bonus section below for tips on selecting a PCF methodology that is right for you and your business.
How Do You Define the Boundaries of a PCF?
Once a methodology is selected, a system boundary needs to be defined. The system boundary identifies which lifecycle stages and processes are included in the analysis.
The five main lifecycle stages are:
Material acquisition & pre-processing
Design & production
Distribution & storage
Use
End-of-life
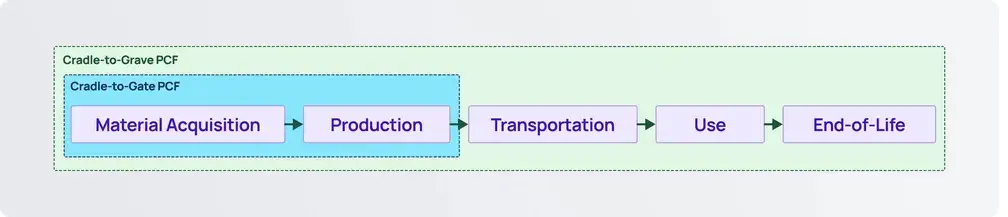
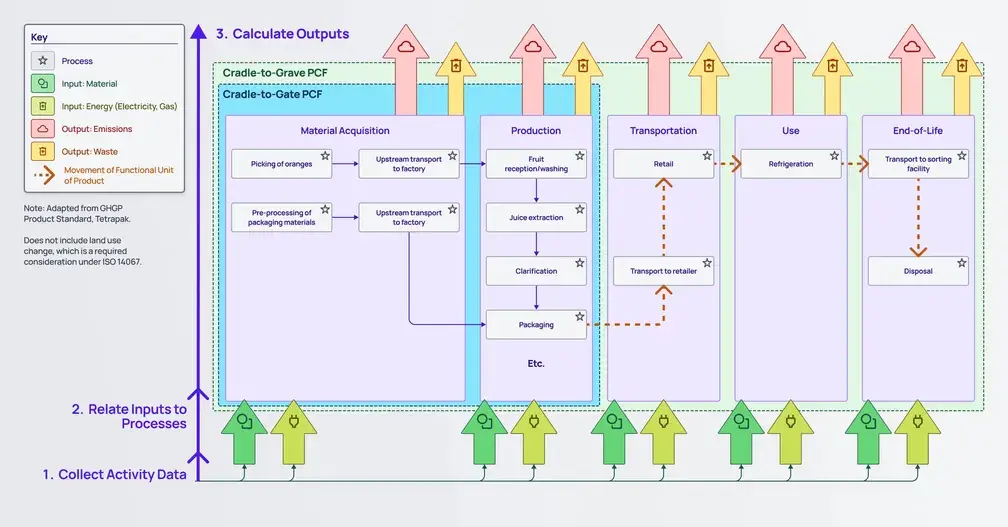
Above are shown the five main lifecycle stages with extents of cradle-to-gate and cradle-to-grave boundaries indicated. Source: Adapted from GHG Protocol Product Standard
PCFs are normally calculated in one of the following ways:
Cradle-to-gate (partial): takes into consideration all processes from extracting resources to be used in manufacturing your product up to the point when your product exits your factory “gate”.
Cradle-to-grave (full): covers the full lifecycle of your product; this includes all the cradle-to-gate process plus emissions downstream of your company’s operations (e.g., disposal of your product once used).
After defining your boundary, you should develop a process map describing all the processes that make it possible for your product to perform its function.
Returning to our orange juice example, for a cradle-to-gate analysis, you’d elaborate all the processes that carry your raw materials to your factory, through your factory machinery, and up to your factory’s exit gates, where packaged cartons are picked up for delivery to customers. Every process would have its own unique energy and material flows.
For example, during the process of juice extraction in the factory, whole oranges and electricity “flow in”, and wet peel, oil emulsion, and juice “flow out”.
A simplified version of a process map for a cradle-to-gate analysis of our orange juice is shown below. We also indicate how you’d expand your process map to conduct a cradle-to-grave analysis.
How Do You Collect the Right Data?
Recall that a PCF is the sum of emissions from the processes linked to your product, calculated by multiplying process activity data by an appropriate emission factor and GWP for each GHG. Here’s our handy equation from before:
𝑔ℎ𝑔𝐸𝑚𝑖𝑠𝑠𝑖𝑜𝑛𝑠=𝑎𝑐𝑡𝑖𝑣𝑖𝑡𝑦𝐷𝑎𝑡𝑎 𝑋 𝑒𝑚𝑖𝑠𝑠𝑖𝑜𝑛𝐹𝑎𝑐𝑡𝑜𝑟 𝑋 𝐺𝑊𝑃
This equation will look familiar if you’ve prepared a company-level GHG inventory (also called corporate carbon footprint) before.
Let’s say your orange juice factory is in Massachusetts. If you were calculating your company’s location-based Scope 2 emissions from purchased electricity, you’d multiply your electricity usage in your factory by a regional grid electricity emission factor, like EPA eGRID NPCC New England, since power usage for your operations is a source of emissions over which your company has control or influence.
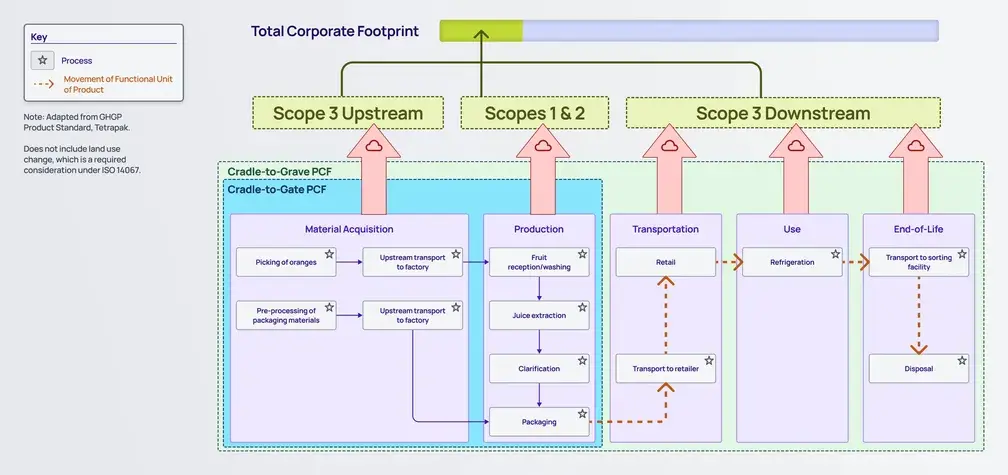
The same rules apply to your PCF. You’d still collect activity data on the electricity usage in your factory. However, you must be careful to measure (or allocate) the portion of that electricity usage involved in the making of a functional unit of your product. For example, while your company-level inventory includes all electricity usage at a factory, your PCF should only include electricity usage by machinery used in the processing of one functional unit of your product.
Bonus Tips for PCF Methodology Selection
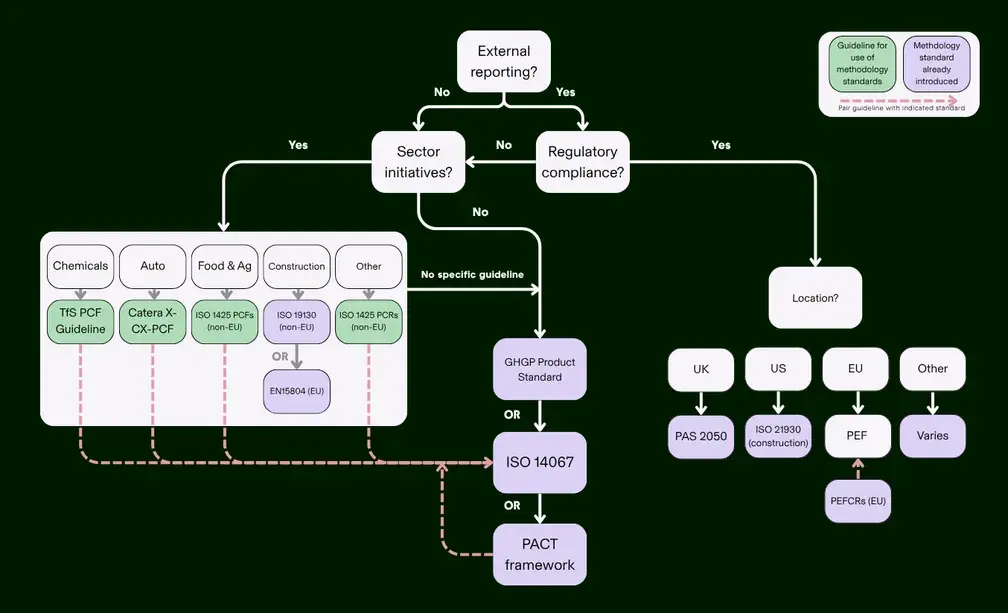
Here’s the short answer: start with ISO 14067 as your quantification backbone and the PACT Framework as your data-sharing layer, then add sector-specific or regulatory standards only where your customers or markets require them.
The standards landscape is less daunting than it looks, because the choice stacks rather than forks. ISO 14067 defines the rules a verifier will check your calculation against; PACT defines what a customer’s system expects to receive. Together they cover the two jobs every PCF has to do: be defensible, and be usable by someone else. Anything more specific layers on top without rework.
From that baseline, the question is whether your customers, sector, or regulators require more. Here are a few example scenarios:
Is a customer asking for your PCF as part of a supply chain engagement campaign, for their sustainability action plans or Scope 3 improvements?
You are not bound by regional regulatory requirements here; your customer’s needs set the bar. A PACT-conformant PCF is robust enough to satisfy most customer requests across industries, and its shared data model means one calculation can answer many customers. One exception: if your business falls within the automotive or chemicals industries, follow the sector-specific Catena-X or TfS standards respectively; customers in those sectors will expect footprints built to those rulebooks, and both are designed to interoperate with PACT.
Are you selling construction materials, say as a US concrete manufacturer whose customers work on government projects?
Then the ISO 21930 standard is the one to layer on. It establishes the core rules for creating externally auditable Environmental Product Declarations (EPDs) for construction materials, which is exactly what you’d submit to a government buyer under Buy Clean programs. Pair it with the applicable Product Category Rules, such as NSF International’s Portland Cement PCR, for cement in North American markets.
Are you selling into a market where a regulator mandates the methodology, like a global battery manufacturer selling into the European Union?
The EU Battery Regulation requires industrial battery manufacturers to attach electronic QR-coded battery passports to their products detailing composition, carbon footprint, and material origin. The PCF must adhere to the EU’s Product Environmental Footprint (PEF) method and the complementary PEFCR (PEF Category Rules) to ensure consistency with your peers’ analyses. When a regulation names the methodology, that choice is made for you — build to it from the start rather than retrofitting.
A few practical tips, whatever stack you land on:
Start from the data request, not the standards list. The actual asks from your customers, regulators, and target markets usually determine the right stack directly.
Don’t over-engineer your first PCF. A cradle-to-gate footprint under ISO 14067 + PACT surfaces your hotspots and satisfies most B2B requests; you can extend it later without starting over.
Document as you go. Write down every boundary, allocation, and data-source choice when you make it. That’s what separates a footprint that sails through verification from one that gets rebuilt for it.
Plan for comparability. Fix your methodological choices once and apply them consistently across your product portfolio.
To get you started with methodology selection, try our decision tree below.
Want to discuss your needs? Our Green Project experts can do a custom screening and recommend a path forward.
How Can Green Project Help?
Green Project’s platform offers a cradle-to-gate Product Carbon Footprinting solution built on the ISO 14067 standard and aligned to the PACT, Catena-X, and TfS frameworks, so your footprints are both defensible to an auditor and share-ready for any customer. It is designed for companies new to product-level carbon reporting: intuitive and easy to use, without compromising quality.
Standards. Footprints follow ISO 14067 and use the PACT data model. If your automotive or chemical customers need Catena-X or TfS, the platform supports those too.
Automation plus a human expert. Software does the repetitive work, like matching your materials to emission factors. A Green Project LCA expert checks the judgment calls: boundaries, allocation, unusual materials.
Documentation. The platform records your methodology choices, data sources, and assumptions as you go, so you have the paper trail an auditor or customer will ask for.
Useful results. Because the footprint is built from your own bill of materials and operations, it shows where your emissions actually come from and what you could change.
Plenty of tools will generate thousands of PCFs at the push of a button, using AI and industry-average data alone. That’s fast, but the result describes a typical product, not yours. It won’t stand up when a customer asks how the numbers were calculated, and it doesn’t tell you anything you can change. We think the better trade is automation for the grunt work and a real LCA expert for the decisions that matter, so the footprint you publish is one you can defend.
About the author

Killian Davin
Decarbonization Solutions Lead
Killian Davin is the Decarbonization Solutions Lead at Green Project Technologies, an AI climate management platform helping businesses of all sizes measure, manage, and reduce emissions across complex global value chains.